
In today’s Product Management and Product Marketing world data is an increasingly important element. Understanding it, using it, processing it, protecting it or even selling it are all potentially important. Data can be used to make decisions about your product’s strategy, design, and marketing as well as within your product to provide more insights for your users.
This post focuses mainly on the use of data by product managers to make decisions. It can be a minefield as for many product managers it’s difficult to know where to start. In this blog, there are some essential and advanced data skills that as a product manager, you might want to consider.
Data is the new oil
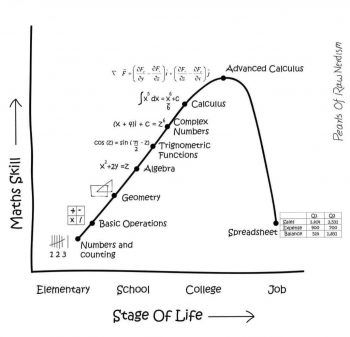
Just before Christmas, I spotted an image doing the rounds on LinkedIn. It showed the level of maths skills that we have throughout our lives. It peaked at College-age with “Advanced Calculus” and then plummeted to “Spreadsheet” in the working world. It made me think about my mathematical ability these days and by extension my data skills.
People often talk about “data as the new oil.” It is considered one of the most valuable business resources there are. However, scandals such as Cambridge Analytica and the introduction of legislation like GDPR means it is a “hot” space, and you have to take some care. For Product Managers to thrive in this new environment, they need to expand their skills and knowledge.
Build some relationships
You might say, what have relationships got to do with data skills? Directly they have little to do with working with data, but you can only work with data once you have it! One of the critical challenges in many organizations can be getting the data in the first place. Much of the data you might need will be hidden away in business systems like SAP.
Anyone who has been on our flagship 3-day training course knows that we recommend that product managers have a dashboard in place for their products to help to manage them in-life. For example, this monthly report will have key data like product revenue and sales numbers to allow product managers to spot trends and have reliable data on which to base decisions. When I found my team without this several years ago I was not happy – so I asked one of my team, Keith Bailey, to take the lead.
We wanted to put dashboards together so that every Product Manager could make decisions supported by performance data for their product and we wanted to make sure that everyone would be able to access them.
Keith had to spend a lot of time working with our Finance Team to work out what reports we could get from SAP and to get their buy-in to providing the data. The relationship-work he did behind these scenes paid off though, and we got what we needed every month. When senior leaders saw the dashboards, they loved them, because they informed and empowered them and us to be more data-driven.
Become an Excel Power User
Most of the time when Product Managers get data it’s in some raw format, e.g. a time series or list of values. This data needs cleaning, sorting, and processing. Luckily enough virtually everyone has a tool that can do this on their PC: Excel.
Excel is pretty powerful; there is a reason why it is used so much in business. When it came to the dashboards that Keith was building, we selected Excel as the tool of choice because everyone had it and could use it.
We also accepted a simple truth; you have to take the data in whatever source it is available and then do any calculations, sorting or other manipulations. Keith was an expert in Excel, so despite there being four or five different SAP reports behind our dashboards all we had to do was copy and paste the latest data in each month, and everything else just worked like magic under-the-hood.
Some people will go so far as to write macros using the built-in programming language. But I’ll be honest; I have not found a need to do this for nearly ten years now. You can do a lot in formulas. With some thought, a little work and a few power tricks you can handle most things.
The good news is that Excel has lots of built-in functions that can help you with everyday tasks and the internet is full of examples where people have solved complex problems. Use your Googling skills, and you will overcome most challenges.
Maybe learn some statistics
It wouldn’t be right to talk about data without mentioning statistics. Statistics is one of those subjects that everyone was scared of back at school. Interestingly, even on the left-hand side of the image at the start, there is no mention of statistics!
I’ll let you into a secret; statistics are merely a way of getting a view of a dataset, they describe the dataset in a smaller number of points. Instead of looking at 1,000, 10,000, 1,000,000, or more data points you might look at measures such as the average, minimum and maximum. These can tell you everything you need to know.
You need to understand some basic terms though. For example, everyone talks about the “average,” but there are three averages: Mean, Median and Mode. The one that everyone uses is the Mean, but the Median and Mode can be handy when looking at datasets.
I would recommend either getting a book or signing up for an online course to understand the basics. I have Beginning Statistics on my bookshelf, and I know my colleague has Statistics for Dummies and has used Statistics and Probability on Khan Academy in the past.
Distributions are not always normal
Another useful thing to understand is distribution curves. Most people will have heard of a “normal” distribution or bell curve, but there are lots of other common distribution curves. When dealing with physical products, for example, the Bathtub Curve is useful to understand. It’s useful because it is the shape of the graph you would expect to see for product failures. Don’t assume everything follows the same distribution!

The Bathtub Curve
Have a plan to build the right skills
One of Harvard Business Review’s Tip of the Day recently started by saying “Figure Out Which Data Skills You Need for Your Job.” It landed just days after I saw the image at the start of the post and got me thinking about the essential data skills for a Product Manager.
The reality is that you can’t learn everything, and somethings will be more useful than others as well as some being harder to determine. HBR recommends using a 2×2 matrix to help you understand and prioritize. Look at your role, look at the team around you, look at your products. Map out the relevant skills.
I am lucky enough that in the team I used to lead I recruited Immanuel Schweizer. He went on to be Head of Data Science at Merck (and now AI Research), so when it came to the question of data skills for Product Managers, I asked him for advice. As he knows Product Management and Data Science I consider him to be an expert in the overlap.
Visualize like a designer
Immanuel reminded me that while getting and manipulating data are one thing, that is only half the battle. You then need to use it. Visualizing data in a way that helps tell a story and support decisions or discussions is not as simple a saying “Insert Graph.” You need to consider using the right visual for the dataset.
I have found the Visual Vocabulary chart from the Financial Times to be useful in selecting the right type of graph. I also have another great book on my bookshelf that is full of guidance: Information Dashboard Design.

Visual Vocabulary by the FT
Visualization tip
One power tip that has stuck with me over the years is to color-code your data appropriately. For example, if there is one line or bar or slice that is most important make it a bit thicker or a vibrant color. If the other data is less important maybe show it all in different shades of grey. That way the data point you want people to look at will “pop” off of the page or screen, and attention will be focused there. Remember that color also carries a subtext, anything colored Red will likely be interpreted as bad, and Green as good!
Know what you are allowed to do with it
Just because you have the data doesn’t mean that you can or should use it in the way you imagine. You need to consider the legalities of that use. In particular, if you are dealing with any personal data, you will find that there are strict restrictions.
If you are looking at product or customer data, you might find that you need to only work with anonymized or aggregated data to avoid some of the issues. And the data might only be allowed to be accessed in specific data centers or by certain people.
You should plan for any data usage from within your product and cover it in the contract, terms, and conditions or user agreement. At the same time check this with a data privacy expert to make sure you are not breaking any industry norms or laws.
Throw in some Business Intelligence or Analytics skills
If you are lucky, you might find that all the data you want is just sitting there waiting to be accessed. It might be already in a Business Intelligence (BI) system or stored in a system to which an analytics package can connect. Tools like Tableau or Power BI allow you to connect to data sources, analyze and visualize the data. In discussions with more and more of our customers on training courses, I keep hearing that their businesses are experimenting with BI systems, which is great to hear.
These systems present a great opportunity and can be a powerful way to implement product dashboards, but they have a learning curve that you need to go through to be effective when using them. However, once they are up and running, it is often much easier to get to the information you need.
How about some Python or R?
When Excel runs out of steam, and eventually it always does, the brave ones out there might consider a programming language to help them process the data that they have. There are lots to choose from, but Data Scientists certainly seem to have two favorites: Python and R. The good news is that the tools you need to work with them are free and they are some of the best beginner languages as well! There are even free online introductory courses available on Datacamp for both Python and R.
Using a programming language like this can be very powerful but it’s not for a beginner. Use one in which you can also start to build models that allow prediction and give you the ability to do some nice visualizations too.

Programming to analyze data
If you are brave, consider Machine Learning
Analyzing lots of data and finding patterns in it can be hard work and time-consuming. Especially if you aren’t an expert. Searching for something meaningful in an ocean of data – finding a signal in the noise – takes real skill. However, Machine Learning uses algorithms that are designed to do just that. You will hear lots of concepts such as supervised or unsupervised learning, reinforced learning and many more.
I was lucky enough to have Immanuel to brief me on this in the past. I know that at this level I would want to make sure I have a good partner who has a real data science background. If the data usage in your business is getting this serious, it is probably a good idea to look at building a team with the capabilities to lead your efforts.
Design your products with data in mind
With the increasing importance of data, I consider it to be best practice to think about the data uses related to your product from day one. Set the product up to capture the data and store it in a way to easily access it for analysis. It might make sense to build an analysis and dashboard capability directly into the product.
In our experience, internal product requirements like data reports often drop down the priority list when compared with customer-facing functionality. Try not to let this happen; otherwise, you lose a vital tool to help your decision making. But don’t forget that some data may come from inside your product. Tools like Google Analytics can provide a lot of insights into how your web-based product is performing as well as simply what brings customers to your website. Don’t overlook these other sources.
Look at your data regularly
Don’t forget to monitor your data regularly. Having it available and using it are two different things. For digital Product Managers, in particular, it is quite common to check daily performance data every morning, to be in a position to make decisions that day. But when we talk to those same Product Managers, they often say that this task is one of the first to slip when fires start.
This might be a valid choice, as there is only so much time in the day, and sometimes fires can get out of hand if not handled quickly. But they also reflected that it then took time and effort to “catch-up” with how their product had been performing; so try not to neglect this activity.
Don’t forget the Why
One of the risks with data is just collecting it for the sake of it. Ending up with too much data. Ending up with useless data. Maybe the wrong data? Simply being unable to find the value in your data because of data overload and the “noise” this creates.
When discussing this post, Immanuel reminded me of the importance of understanding the “why.” Why are you collecting the data? Why are you analyzing the data? In general, for Product Management, this might be to help you make product decisions, but there are likely to be many more benefits to be had.
You might want to see how a feature is used or performing. Or you might be looking at how users are interacting with your product. Or maybe to see how a system is scaling under real customer usage. There are lots of questions you can answer with the right data so take some time out to understand the problem before you dive into the data.
Start your data journey
Data is a big trend so as a product manager it’s likely you’ll need to get to grips with it. My advice is to make sure you’ve got at least basic Excel skills and don’t hesitate to pull in the data scientists if you need help with more complex challenges.
Phil Hornby
Independent Consultant
Join the conversation - 2 replies
Great post and mirrors our experience. We’ve certainly been making our data more transparent using the tools listed, you can do a lot with a basic knowledge of Google Analytics and some pretty Google Sheets. We’ve also been experimenting with Google Tag manager which lets you set up tracking on individual button clicks without having to get development to make changes.
For us the main benefit has been running betas and having data to share with internal stakeholders about what is or isnt happening. We were finding before a lot of stuff was opinions, now we can show whether our betas are working or not and either pull them or do more.
I love this quote which has become our mantra “If we have data, let’s look at data. If all we have are opinions, let’s go with mine.” (Jim Barksdale)
Hi Ian, glad it resonates. I might steal that quote as it is so spot on! I have to admit most of my mileage personally has been mining internal data sources like SAP and looking at Google Analytics is something I am just starting, but already seeing useful information!